

A data-driven, human-centered comparison for policymakers, project developers, energy enthusiasts, and anyone curious about our clean energy transition
By Malota Studio — malotastudio.net
Why This Question Matters More Than Ever
Picture this: You’re standing in an open field on a breezy afternoon, the sun warming your face while wind rustles through the grass. Both forces—sunlight and wind—have powered human civilization for millennia, from ancient sailboats to windmills grinding grain. Today, we’re asking these age-old energy sources to do something extraordinary: replace fossil fuels and power our modern world.
But here’s the thing that keeps energy planners, policymakers, and developers awake at night: When you’re choosing between building a solar farm or a wind farm, which one should you pick? Which delivers more bang for your buck? Which fits better with your community’s needs? Which will actually keep the lights on?
The answer, frustratingly and beautifully, is: it depends. And that’s exactly what we’re here to unpack.
Executive Summary: What You Need to Know Right Now
Let me be upfront: choosing between utility-scale solar photovoltaic (PV) and onshore wind isn’t like picking between chocolate and vanilla. It’s more like choosing between a sports car and an SUV—each excels in different conditions, and the “best” choice depends entirely on where you’re going and what you’re carrying.
Effectiveness hinges on multiple metrics: How much does it cost to generate each kilowatt-hour? How much energy does the plant actually produce compared to its theoretical maximum? How much land does it consume? Can your local grid handle its variability? What does your region’s weather actually look like?
The good news? We have solid data to guide these decisions. The even better news? Both technologies have become so competitive that in many cases, you can’t go wrong—you’re just optimizing for different priorities.
Throughout this guide, I’ll walk you through the numbers, the nuances, and the real-world considerations that matter. Every major claim is backed by recent research from organizations like the International Energy Agency (IEA), the International Renewable Energy Agency (IRENA), the U.S. National Renewable Energy Laboratory (NREL), and Lazard’s authoritative cost analyses. You can verify everything yourself—because good decisions require good data.
The Quick Comparison: Numbers at a Glance
Before we dive deep, let’s get oriented with a snapshot of how these technologies stack up globally:
| Metric | Utility-scale Solar PV (recent global averages) | Onshore Wind (recent global averages) | Data source(s) |
|---|---|---|---|
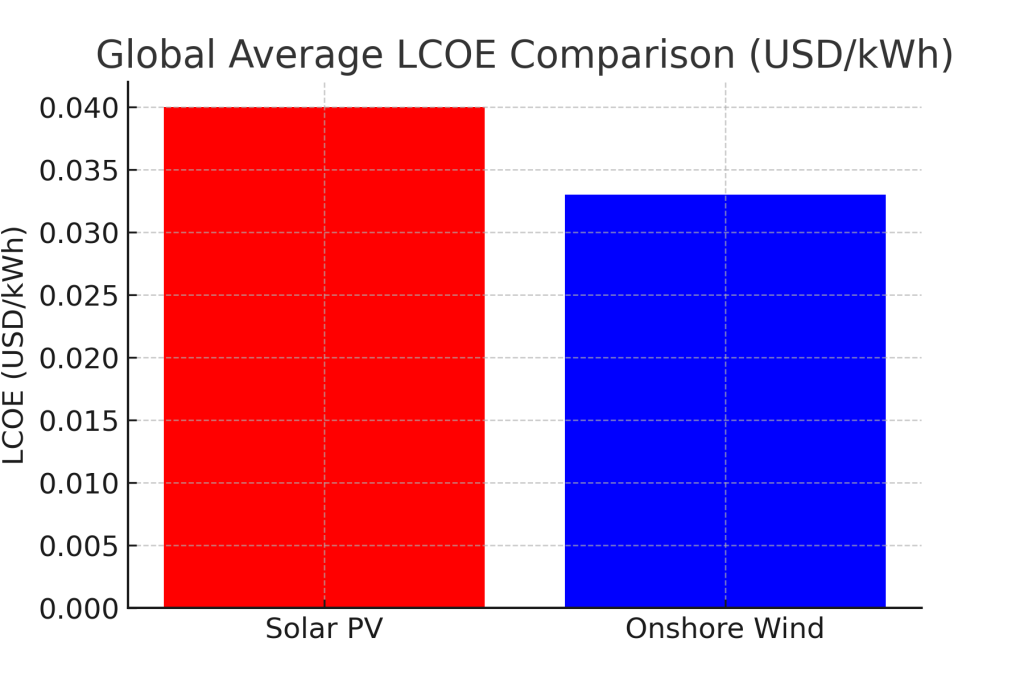
| Typical global weighted average LCOE (USD / kWh) | ~$0.04 / kWh (44 $/MWh) | ~$0.033 / kWh (33 $/MWh) | IRENA (2023). (IRENA) |
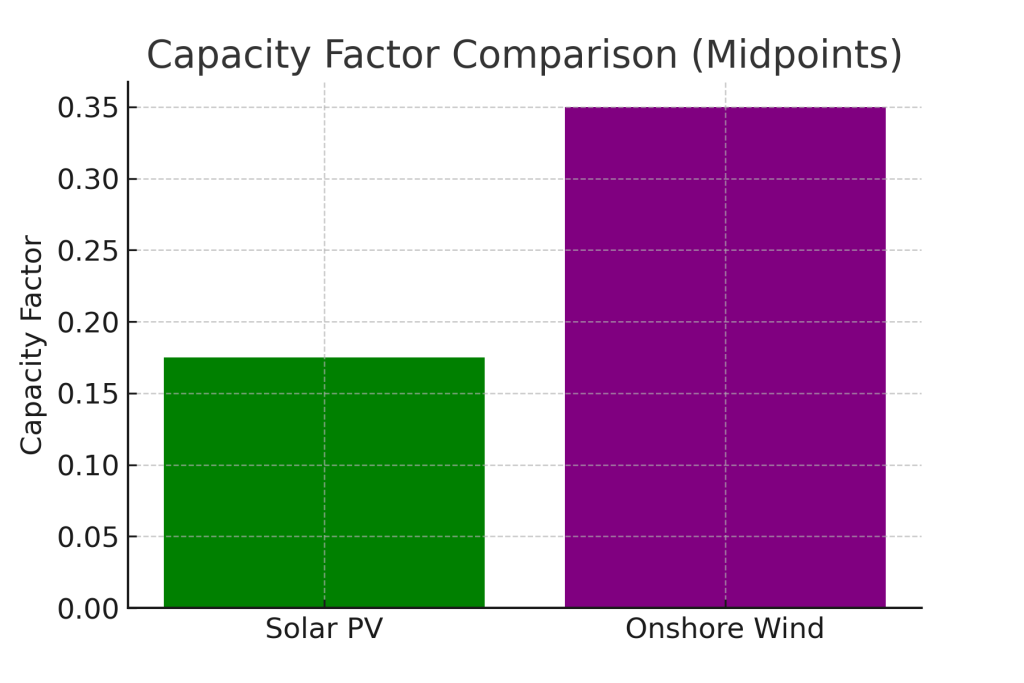
| Capacity factor (typical range) | 10–25% (varies with location, utility vs rooftop) | 25–45% (site dependent) | NREL; IRENA capacity/capacity-factor tables. (Dokumen NREL) |
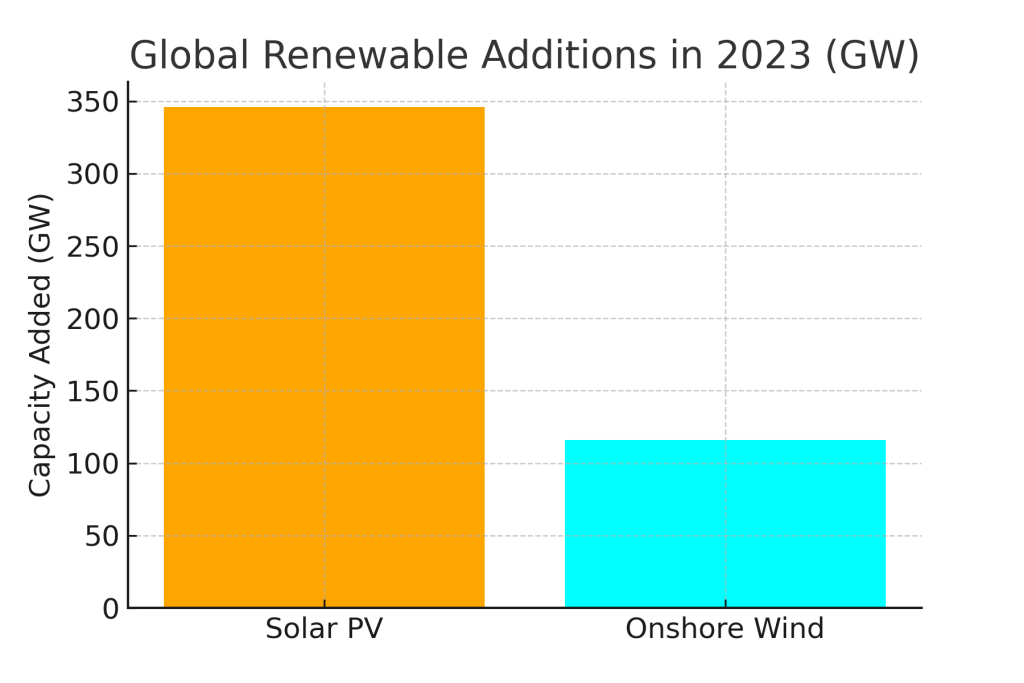
| Global additions in 2023 (GW added) | ~346 GW (PV additions in 2023) | ~116 GW (wind additions in 2023) | IRENA capacity statistics 2024. (IRENA) |
| Land use (direct footprint / MWh) | Lower operational footprint; larger contiguous area for arrays (rooftop + dual-use options) | Larger turbine spacing but smaller physical foundations footprint; greater usable land beneath turbines | NREL land-use and LBNL analyses. (The Department of Energy’s Energy.gov) |
| Overnight capital cost sensitivity | Falls rapidly with module prices / BOS | More sensitive to turbine supply chain and site-specific civil works | Lazard LCOE and NREL analyses. (https://lazard.com) |
Important caveat: These are global averages. Your actual numbers will vary based on your region’s sunshine, wind patterns, financing terms, government incentives, local labor costs, and a dozen other factors. Think of these as helpful baselines, not absolute truths.
Deep Dive: The Economics—What Will This Actually Cost?
Understanding LCOE: The Great Equalizer
Let’s start with everyone’s favorite acronym: LCOE, or Levelized Cost of Energy. Think of LCOE as the average price per kilowatt-hour over a plant’s entire lifetime, accounting for everything—initial construction, ongoing operations, maintenance, financing costs, and how much energy you actually generate.
It’s like calculating the per-mile cost of owning a car: you factor in the purchase price, gas, insurance, repairs, and how many miles you’ll drive. LCOE lets us compare apples to apples (or at least, solar panels to wind turbines).
Recent industry analyses show something remarkable: both technologies have become incredibly competitive with—and often cheaper than—fossil fuel generation. Global average LCOE estimates place utility solar around four cents per kilowatt-hour, while onshore wind comes in slightly lower at about 3.3 cents. To put that in perspective, that’s less than what many utilities paid for coal or natural gas generation just a decade ago.
But here’s where it gets interesting: these averages mask enormous regional variation. In sun-drenched regions like the Middle East, North Africa, or the American Southwest, solar can achieve LCOE values well below three cents per kWh. Meanwhile, in consistently windy areas—coastal regions, plains, mountain passes—wind farms regularly deliver power at two to three cents per kWh.
The Price Drop Revolution
Solar’s cost decline over the past decade has been nothing short of miraculous. We’re talking about a technology that has seen its costs plummet by over 80% since 2010, primarily thanks to massive manufacturing scale-up in module production, improved efficiency, and streamlined installation processes. When you can manufacture solar panels by the millions, economies of scale work their magic.
Wind has also seen significant cost reductions, though the story is slightly different. Turbines have grown dramatically larger—modern machines stand as tall as 80-story buildings with blade spans wider than football fields—which has improved their efficiency and energy capture. However, wind costs are more sensitive to local conditions: transportation logistics for massive turbine components, site-specific foundation engineering, and grid connection distances all play major roles.
What This Means for Your Wallet (or Budget)
Here’s the practical takeaway: in many sunny regions, solar delivers the lowest cost per megawatt-hour generated. In windier regions, wind’s higher capacity factor (we’ll get to that next) often makes it the cheaper option per unit of delivered energy, even when capital costs are similar.
But—and this is crucial—cheap doesn’t automatically mean best. A super-cheap energy source that only works four hours a day might not be as valuable as a slightly more expensive one that generates power 24/7. This is where things get delightfully complicated.
Generation Reliability: Will the Lights Actually Stay On?
Capacity Factor: The Reality Check
Let’s talk about capacity factor, because this is where theory meets reality. Capacity factor tells you what percentage of its theoretical maximum output a power plant actually achieves over time.
Imagine you buy a 100-megawatt solar farm. If it ran at full capacity every single hour of every single day for a year, it would generate 876,000 megawatt-hours (100 MW × 24 hours × 365 days). But of course, the sun doesn’t shine at night, clouds pass overhead, winter days are shorter, and panels need occasional cleaning. So in reality, your 100 MW solar farm might only generate 175,000 to 219,000 MWh per year—a capacity factor of 20-25%.
Typical capacity factor ranges:
- Solar PV: 10-25% is common globally, with higher values (25-30%) achievable in exceptional locations like the Atacama Desert or Arizona. Rooftop installations, with their suboptimal angles and occasional shading, typically hit the lower end of this range.
- Onshore wind: 25-45% depending on wind quality and site selection, with the best sites in consistently windy regions (think the Great Plains, Scotland’s highlands, or Patagonia) sometimes exceeding 50%.
Here’s why this matters: A 100 MW wind farm in a good wind area generating at a 40% capacity factor produces 350,400 MWh annually—roughly double what a 100 MW solar farm at 20% capacity factor produces (175,200 MWh). Same nameplate capacity, very different energy output.
The Intermittency Dance: When and How Power Flows
Both solar and wind are intermittent—but in different, sometimes complementary ways.
Solar is beautifully predictable in its unpredictability. You know it won’t work at night. You know it peaks around midday. You can forecast tomorrow’s solar generation with reasonable accuracy based on weather patterns. The challenge is that solar’s peak generation often coincides with lower electricity demand in many regions, creating that famous “duck curve” problem where grid operators scramble to balance supply and demand during evening ramps.
Wind is the wild card. It can blow day or night, summer or winter. In many regions, wind patterns are actually inverse to solar—stronger at night, stronger in winter. This complementarity is incredibly valuable. When solar fades in the evening, wind might be picking up. When winter clouds reduce solar output, winter storm systems could be driving turbines at full tilt.
The International Energy Agency and regional grid planners increasingly emphasize that the smartest approach isn’t choosing between solar and wind—it’s strategically combining them. A diverse portfolio of both technologies, paired with storage and flexible demand, creates a more stable, reliable renewable grid than either technology alone could provide.
Land Use: How Much Space Do We Really Need?
The Footprint Question
Here’s where conventional wisdom often gets things backwards. People see a solar farm’s sea of panels and assume it uses more land than wind’s widely-spaced turbines. The reality is more nuanced.
Solar PV requires contiguous land for its arrays—those rows of panels need direct sunlight without shadowing each other. NREL and Lawrence Berkeley National Laboratory studies show that utility-scale solar farms typically require about 5-8 acres per megawatt of installed capacity. That sounds like a lot, and visually, it is—the land is clearly “occupied” by solar infrastructure.
But here’s the interesting part: much of the land under and between solar panels can support dual use. Agrivoltaics—farming beneath solar panels—is a growing field. Sheep grazing under solar arrays is increasingly common. Native pollinator habitats can thrive in the shaded, protected environment under panels. And of course, rooftop solar uses no additional land at all—it’s exploiting otherwise unused space.
Onshore wind needs significant spacing between turbines to avoid wake effects (when one turbine’s wind shadow affects another). A wind farm might span thousands of acres, but the actual turbine foundations, access roads, and substations occupy only about 1-3% of that total area. The remaining 97-99% can continue to be used for agriculture, grazing, or natural habitat. Farmers often welcome wind turbines because lease payments provide stable income while they continue farming around the foundations.
The Bottom Line on Land
If you’re trying to minimize total land area affected by energy infrastructure, properly sited wind farms are often more land-efficient per megawatt-hour generated. If you’re trying to minimize land-use conflict, or if you have limited land availability, solar’s rooftop potential, brownfield opportunities (former industrial sites), and even floating solar on water bodies make it incredibly versatile.
Neither approach is inherently “better”—they’re tools for different contexts.
Deployment Speed: How Fast Can We Build?
Here’s where solar has absolutely dominated in recent years. In 2023, the world added approximately 346 gigawatts of solar capacity compared to 116 GW of wind—nearly triple the deployment rate.
Why the disparity? Several factors:
Solar’s advantages:
- Modularity: You can build a 1 MW system or a 1,000 MW solar farm using the same basic components, just more of them. Wind requires custom planning for each site.
- Faster permitting: Rooftop and small commercial solar often face minimal permitting hurdles. Even utility-scale solar typically clears regulatory processes faster than wind.
- Simpler logistics: Solar panels ship in standard containers. Wind turbine blades require specialized transport, sometimes necessitating road modifications.
- Distributed potential: Solar works at every scale from 5-kilowatt rooftop systems to gigawatt-scale solar parks. Wind really only makes economic sense at utility scale.
This matters enormously for policy and climate goals. When you need to add renewable capacity quickly—whether to meet climate targets, replace retiring fossil plants, or serve growing demand—solar’s deployment speed is a massive advantage.
But speed isn’t everything. Wind’s higher capacity factor means fewer installed megawatts can generate the same annual energy. You might need 300 MW of solar to match the annual output of 150 MW of wind in some locations.
The Grid Integration Challenge: It’s Not Just About Generating Power
Here’s an uncomfortable truth that took the renewable energy industry years to fully acknowledge: generating cheap renewable electricity is only half the battle. Getting that power to customers when they need it—that’s the real challenge.
Storage and Flexibility Costs
Solar’s daytime generation peak creates a problem: in regions with high solar penetration, midday electricity can become so abundant that prices go negative, forcing grid operators to curtail (waste) solar generation. Without storage, all that cheap midday power disappears just as evening demand peaks and people come home, turn on air conditioning, start cooking, and plug in electric vehicles.
Wind’s variability presents a different challenge. Wind forecasting has improved dramatically, but unexpected wind droughts or surpluses still require grid flexibility—either through quick-ramping natural gas plants, battery storage, demand response programs, or interconnections with neighboring grids.
Both technologies increasingly require pairing with battery storage or other flexibility solutions. Lazard’s LCOE+ analysis and national grid integration studies show that the delivered cost of renewables changes significantly when you add the required storage and grid upgrades. A three-cent-per-kWh solar plant might need an additional two cents per kWh in storage costs to provide reliable evening power.
The good news? Battery costs are plummeting, following a similar trajectory to solar panel costs. And creative solutions—vehicle-to-grid systems, green hydrogen production, smart demand response—are emerging to absorb excess renewable generation productively.
The Practical Decision Guide: Which Should You Choose?
Alright, let’s get practical. You’re a city councilor, a utility planner, a corporate sustainability officer, or a community energy cooperative member. You need to make a decision. Here’s how to think about it:
Choose Solar When:
- You have abundant sunshine. This seems obvious, but it’s worth stating: solar economics work best in high-insolation areas. If you’re in northern latitudes with long, dark winters, solar’s capacity factor suffers dramatically.
- You have rooftop or dual-use opportunities. Got warehouses, parking lots, or agricultural land? Solar can generate power while serving other purposes.
- You need fast, modular deployment. Meeting an aggressive clean energy deadline? Solar can scale quickly.
- Distributed generation matters. Solar’s ability to generate power close to where it’s consumed reduces transmission losses and improves grid resilience.
- Community acceptance is easier. Many communities find solar farms less visually imposing than wind turbines, though this varies culturally and individually.
- You’re targeting midday demand peaks. If your primary challenge is air conditioning load on hot summer afternoons, solar is perfectly timed.
Choose Wind When:
- You have consistently strong wind resources. This is non-negotiable. A wind farm in a weak wind area is expensive power. Wind resource maps and detailed site assessments are essential.
- You have access to large, remote sites. Wind farms need space and work best away from dense development (both for siting ease and to avoid conflicts over noise and visual impact).
- Higher capacity factor is crucial. If you’re trying to maximize annual energy generation from limited grid connection capacity, wind’s superior capacity factor matters enormously.
- You need more consistent generation patterns. Wind often generates during different hours than solar, providing valuable evening and overnight power.
- Land use compatibility is possible. If you can integrate wind turbines with ongoing agricultural use, you maximize land productivity.
Or Better Yet: Choose Both
Increasingly, the smartest answer is a portfolio approach. Solar handles sunny days, wind covers nights and cloudy periods, storage smooths the remaining gaps, and together they create a more reliable renewable system than either could achieve alone.
Two Quick Reference Tables
Table A: Performance & System Needs
| Question | Solar PV | Onshore Wind |
|---|---|---|
| Is daytime peak shaving required? | Excellent | Limited |
| Is high capacity factor required? | Lower | Typically higher |
| Best paired with rooftop/urban deployments? | Yes | No |
| Remote large-scale land with farming underneath? | Possible (but panels cover more surface) | Often better (sparse foundations) |
Table B: Economic Tradeoffs
| Economic factor | Solar | Wind |
|---|---|---|
| Capital cost sensitivity | Module prices drop can reduce costs quickly | Turbine and installation costs, supply chain sensitive |
| Scarcity value (grid/time) | Midday value high | Evening/seasonal value possible |
Beyond the Spreadsheet: Human-Centered Planning
Here’s what doesn’t show up in LCOE calculations but matters enormously in the real world:
Community Buy-In
The best renewable project from a technical and economic standpoint can still fail if it doesn’t have community support. Wind farms face opposition over visual impact, noise (real and perceived), and concerns about wildlife (particularly birds and bats). Solar farms face pushback over land use, particularly when proposed for agricultural or environmentally sensitive areas.
Successful projects involve communities early, address concerns transparently, and often share benefits—through community ownership stakes, local hiring, property tax revenue, or direct payments to affected landowners.
Permitting and Regulatory Realities
Permitting timelines can dwarf construction timelines. A wind project might take 1-3 years to build but 3-7 years to permit. Environmental reviews, local zoning battles, grid interconnection queues, and appeals processes all add time and uncertainty.
Solar often (though not always) faces faster regulatory processes, particularly for rooftop and smaller commercial projects. But utility-scale solar can still face significant permitting challenges, especially regarding habitat protection, cultural resources, and agricultural land preservation.
Job Creation and Local Manufacturing
Both technologies create jobs, but in different ways and at different points in the supply chain. Solar employs more people in installation (due to higher installation frequency and modularity). Wind creates specialized, high-paying jobs in turbine manufacturing and maintenance. Both support local jobs in project development, grid connection, and ongoing operations.
Wildlife and Ecosystem Considerations
Wind turbines can impact birds and bats, though modern careful siting, seasonal curtailment during migration periods, and improved turbine designs have significantly reduced these impacts. Solar farms can disrupt habitat if poorly sited, but can also provide valuable habitat if designed thoughtfully—think pollinator-friendly ground cover and leaving spaces for wildlife movement.
Neither technology is perfect, but both are dramatically better for ecosystems than fossil fuel alternatives when we account for climate change impacts.
The Resources: Where to Dig Deeper
Want to explore these topics further? Here are the authoritative sources I’ve drawn on:
- IRENA—Renewable Power Generation Costs in 2023: The gold standard for global LCOE data and cost trend analysis. Updated annually with country-specific breakdowns.
- IEA—Renewables 2024 / Global Overview: Comprehensive data on deployment trends, policy analysis, and grid integration challenges worldwide.
- NREL—Solar PV and Land Use / Technical Potential Reports: Detailed, peer-reviewed analyses of land requirements, capacity factors, and technical potential for U.S. renewable resources. Methodology applicable globally.
- Lazard—LCOE+ (2025): Detailed unsubsidized cost ranges that include sensitivity analyses and emerging technologies. The LCOE+ framework includes storage and firming costs.
- Arup / UK Government—Onshore Wind and Solar PV: Cost of Electricity Report (2024/2025): Regional LCOE comparisons with detailed methodology and assumptions.
These aren’t marketing materials or advocacy pieces—they’re rigorous analytical work from organizations with strong reputations for data quality and transparency.
The Honest Conclusion: There’s No Universal Winner (And That’s Okay)
So, which is more effective—solar or wind?
If you judge purely by recent global LCOE averages, onshore wind often has a slight cost advantage per megawatt-hour and achieves higher capacity factors in good wind sites. If you judge by deployment speed, global growth rates, and versatility across scales from rooftop to utility, solar wins decisively.
But here’s what I’ve learned after years of following renewable energy development: asking “which is better” is often the wrong question. The right question is: “What’s the best energy solution for this specific place, with these specific resources, serving these specific needs, within these specific constraints?”
Sometimes that’s solar. Sometimes it’s wind. Increasingly, it’s both, working together, backed by storage, supported by smart grids, and integrated into a larger clean energy system.
The truly smart approach involves:
- Rigorous site assessment: Actually measure your local solar irradiance and wind speeds. Don’t guess.
- Full system modeling: Include generation, storage, transmission, and grid integration costs in your analysis.
- Portfolio thinking: Consider how different technologies complement each other rather than compete.
- Community engagement: Involve stakeholders early and design projects that serve local needs and values.
- Flexibility: Be ready to adapt as technology costs shift, policy environments change, and climate patterns evolve.
The renewable energy transition isn’t a simple swap—replace coal with solar, replace gas with wind. It’s a fundamental reimagining of how we generate, distribute, store, and consume energy. Both solar and wind are essential tools in that transformation.
The exciting news? We have the technology. We have the economics. We’re learning the grid integration solutions. Now we need the will, the planning, and the wisdom to deploy these tools effectively, equitably, and at the scale the climate crisis demands.
The choice isn’t really solar versus wind. It’s fossil fuels versus a clean energy future. And in that battle, solar and wind are on the same team.
Resources & further reading (H2)
- IRENA — Renewable power generation costs in 2023 (LCOE and cost trends). IRENA
- IEA — Renewables 2024 / Global overview (deployment trends and system integration). IEA+1
- NREL — Solar PV and land use / technical potential reports (detailed land-use and capacity-factor data). Dokumen NREL+1
- Lazard — LCOE+ (2025) (detailed unsubsidized cost ranges and storage economics). https://lazard.com
- Arup / UK Gov report — Onshore Wind and Solar PV: Cost of Electricity Report (2024/2025) for regional LCOE comparisons. Gov.uk
This guide was created to provide transparent, data-backed information to support better renewable energy decisions. Have questions, corrections, or additional data sources to suggest? We’re always looking to improve these resources. Reach out through Malota Studio at malotastudio.net.